

Once you’ve decided that NetFlow is part of your cyber defense strategy (check our guide on NetFlow in cybersecurity if you need arguments as to why it should be), you may have run into a problem: choosing the right tools. The tool market is anything but straightforward. There are several things you need to know first before you can decide.
- Roles and functions of the tool: Different NetFlow security tools do different things:
- NetFlow collectors receive, normalize, and store flow records exported by network devices.
- NetFlow analyzers extract insights from collected flow data, such as traffic baselines, anomalies, security incidents, etc. Many tools are both analyzers and collectors.
- Flow brokers aggregate, filter, deduplicate, and redistribute flow data from multiple exporters and collectors. Some operate at a large scale and provide access to aggregated flow intelligence without requiring customers to build their own collection infrastructure.
- Finally, SIEMs, NDRs, and other security platforms can often ingest NetFlow to enrich detections, investigations, and network visibility.
- First-party vs. third-party: You also need to base your decision on what kind of traffic flow data you care about more. Tools that draw on aggregated, internet-wide NetFlow data give you external traffic visibility, while those that collect flows from your own routers and switches can also show you what’s happening inside your network. Spoiler alert: probably, it’s great to have both. But you have to start somewhere, right?
- Data correlation: There’s also the question of what happens to the data after it’s collected. Raw NetFlow records primarily describe communication metadata such as hosts, ports, protocols, and traffic volumes. To turn that into actionable intelligence, the data needs to be correlated with something else — threat intelligence feeds, vulnerability context, behavioral baselines. The best NetFlow tools either bring that correlation built in or connect cleanly to platforms that do.
- Protocol support: NetFlow is the protocol developed by Cisco Systems, but IPFIX (the IETF standard that evolved from NetFlow version 9) and sFlow are widely used, too. Most modern tools support all three, but it’s worth verifying before you choose a tool.
With that said, you either collect your own NetFlow, use global aggregated data, or do both. Tools that rely on aggregated data are much rarer, so let’s start with them.
Aggregated External NetFlow Intelligence Providers
These NetFlow security tools don’t require you to deploy collectors or configure your routers. Instead, they tap into globally sourced NetFlow datasets to provide visibility into internet-wide traffic flow patterns.
1. Attaxion LiveSight
Attaxion LiveSight is an agentless exposure management platform that uses NetFlow to improve visibility into external assets and their network activity.
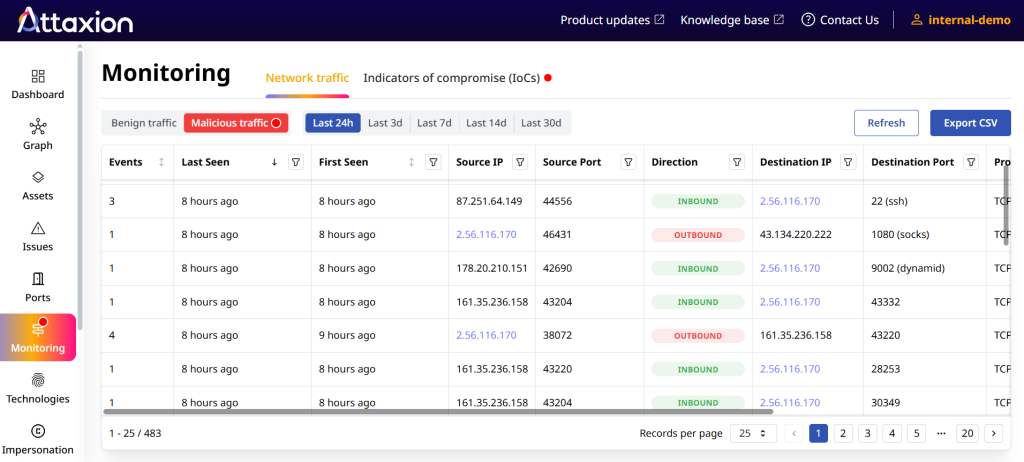
Most exposure management platforms rely on DNS pivots and certificate transparency logs to discover assets. Attaxion LiveSight goes a step further by incorporating NetFlow data. This allows it to verify which assets are truly active, determine which ports and services are seeing traffic, and flag assets communicating with known malicious IP addresses. The result is better asset discovery and more accurate exposure prioritization.
Key features:
- Built-in threat intelligence
- Near real-time detection of malicious traffic
- Retroactive traffic data is available immediately after enabling the feature (no need to wait while the data is being collected)
- Vulnerability context layered on top of traffic data for prioritization
- Fully agentless, no deployment required
Pros: No infrastructure to manage. Correlates traffic with vulnerability intel in one place. Useful for risk prioritization, incident response, and threat hunting.
Cons: Offers sampled aggregated external NetFlow. Doesn’t have visibility into internal flows, so it cannot substitute an internal flow collector or a full network monitoring platform.
Protocol support: In theory, Attaxion LiveSight gathers and normalizes NetFlow, IPFIX, and a variety of other flow protocols. In practice, that doesn’t anyhow affect the user because the data is gathered and normalized on Attaxion’s side.
Pricing: Attaxion LiveSight is an enterprise-focused product, so no public pricing is available. You can book a demo with Attaxion’s experts to discuss pricing that would depend on the number of external assets that you want to monitor.
2. Team Cymru
Team Cymru is a threat intelligence provider, with NetFlow being one of the main drivers behind its offerings. It’s hard to classify Team Cymru’s tools with the classification we’re using, as they don’t really fall under any of the categories.
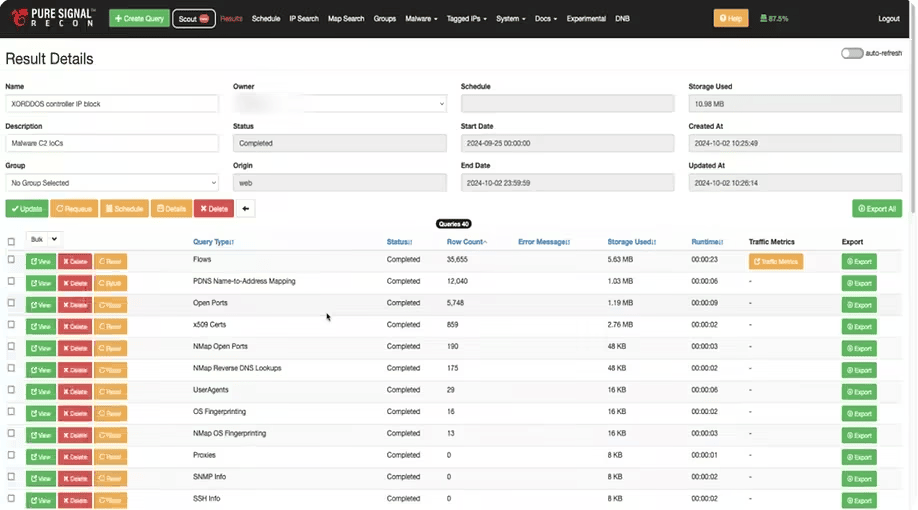
Team Cymru’s RADAR is a real-time threat detection and network monitoring tool powered by aggregated NetFlow intelligence. Pure Signal Recon is a threat intelligence tool that relies on different sorts of Internet telemetry, including NetFlow. And Pure Signal Scout is more of an external attack surface management tool.
What’s interesting about Team Cymru’s products is that they allow users to both collect and analyze their own NetFlow data and use global aggregated NetFlow.
Team Cymru’s collectors installed on the user’s network infrastructure stream the organization’s NetFlow, normalizing it and enriching it with threat intelligence. Then the analytics engine on Team Cymru’s side processes this data, identifying threats and anomalies.
Key features:
- Historical data retention
- C2 tracking and botnet infrastructure mapping
- Query interface designed for threat hunting and incident response
Pros: Integrations with major SIEM, SOAR, and TIP platforms. Useful across threat hunting, incident response, and third-party risk.
Cons: Designed for advanced analysts. The volume of data can be overwhelming without a clear investigative question. Extremely expensive.
Protocol Support: Accepts NetFlow, IPFIX, and sFlow.
Pricing: Annual per-user subscription. Pricing is available on request.
NetFlow Analyzers and Collectors
These tools receive flow exports from your own routers and switches, then store and analyze the data. You’re responsible for getting the flows to them, which means your network devices need to support flow export and be configured to send traffic to the collector.
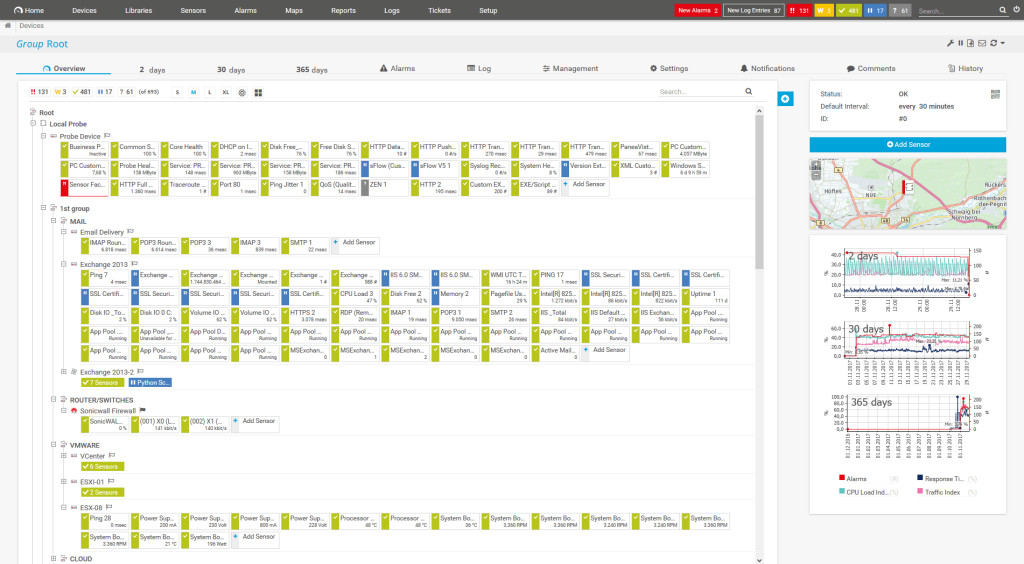
3. Paessler PRTG
Paessler PRTG is a sensor-based network monitoring platform. Each sensor monitors one specific metric, whether that’s bandwidth on one interface or CPU load on a server. NetFlow analysis is one capability among many.
PRTG has dedicated sensors for NetFlow version 5 and 9, as well as IPFIX, sFlow, and jFlow. Each sensor can be configured to filter and group traffic by type, giving you network visibility, particularly into bandwidth consumption and traffic breakdown by protocol or application.
Key features:
- 250+ preconfigured sensors covering NetFlow, SNMP, WMI, sFlow, IPFIX, and packet sniffing
- Auto-discovery to scan networks and deploy sensors automatically
- Threshold-based alerting via email, SMS, push notifications, and API hooks
- Distributed monitoring with remote probes across multiple sites
Pros: One platform for network, server, and application monitoring. Broad protocol support. Well-documented and widely used.
Cons: Pricing can get too expensive for large environments. A very limited number of Linux sensors. Not cloud-native (even though Paessler now offers PRTG Hosted Monitor, a cloud-hosted version), which is a friction point for teams running Kubernetes or containerized workloads.
Protocol support: NetFlow v5, NetFlow v9, IPFIX, sFlow, jFlow
Pricing: As of June 2026, plans start at $200/month for up to 50 devices (PRTG 500), going up to $1,642/month for up to 1,000 devices (PRTG 10000). Mid-tier options include $358/month for 100 devices, $742/month for 250 devices, and $1,300/month for 500 devices. A 30-day free trial is available.
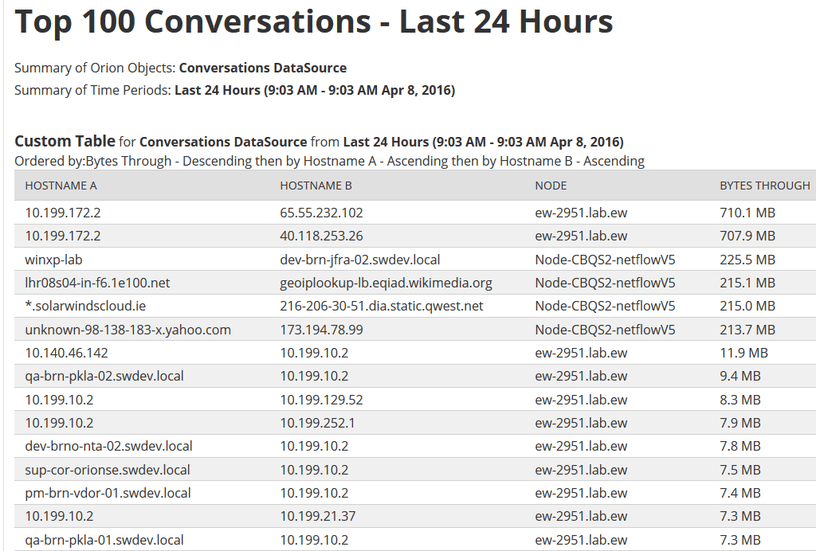
4. SolarWinds NetFlow Traffic Analyzer (NTA)
SolarWinds NTA is a flow-based traffic analysis module designed to fit into the SolarWinds ecosystem. It pairs with Network Performance Monitor (NPM) to give network teams detailed visibility into bandwidth consumption, top talkers, and application traffic patterns.
The analyzer accepts flow data from devices that export supported flow formats, including Cisco NetFlow/NBAR2, Juniper J-Flow, Huawei NetStream, sFlow, and IPFIX. It normalizes the data into a unified view and lets you drill into traffic details by IP address, application, protocol, or interface.
Key features:
- Customizable dashboards and alerting
- Historical and real-time monitoring of bandwidth
- Traffic analysis by application, protocol, conversation, and endpoint
- Vendor-agnostic flow collection from multiple device manufacturers
Pros: Good network visibility into application-level traffic. Strong report customization.
Cons: Not available as a standalone product. Requires SolarWinds NPM, which adds to the cost.
Protocol support: NetFlow, sFlow, J-Flow, IPFIX, and others
Pricing: Price is given upon request, but a user’s post on Reddit mentioned that the NPM subscription alone for 1,000 devices was at $13,600. A 30-day free trial is available.
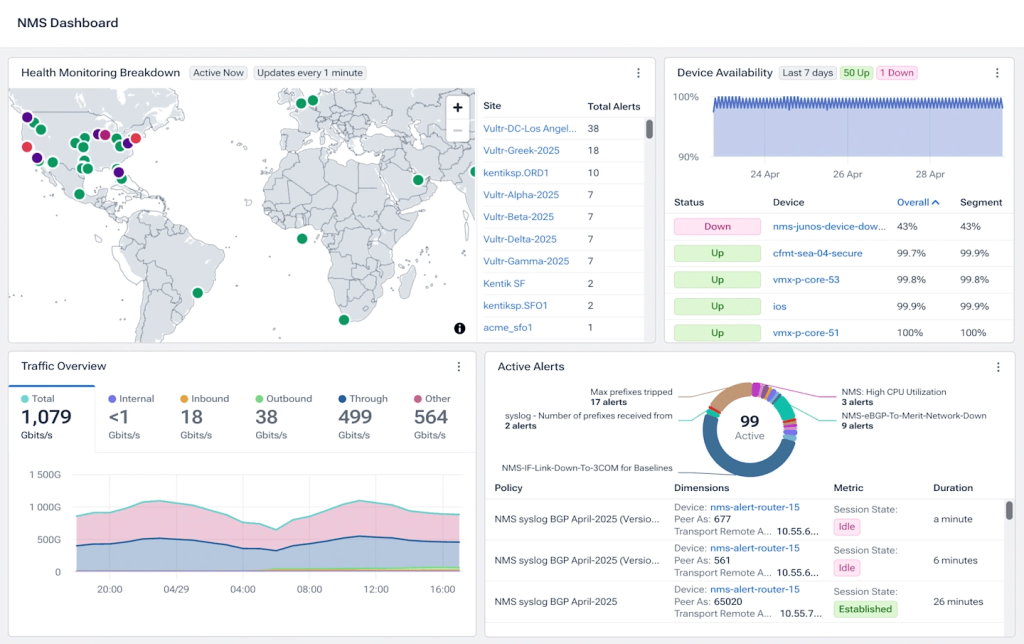
5. Kentik
Kentik Network Intelligence Platform is a cloud-native network observability platform built for large-scale environments. Its network telemetry layer collects and unifies data from all your networks in one place and scales automatically during peak traffic periods.
It pairs network data with BGP routing data, synthetic monitoring results, and cloud telemetry, then runs AI-driven analytics on top. You get real-time visibility into traffic engineering decisions, DDoS attack detection, capacity planning, and application performance.
Key features:
- Observability data pipeline (Kentik Firehose) to export enriched data to other analytics tools or data lakes
- AI-powered anomaly detection, cause analysis, and DDoS protection
- Synthetic monitoring and cloud cost intelligence
- Universal Data Explorer for ad-hoc querying across all telemetry types
Pros: Handles telemetry types that most NetFlow-focused tools don’t, including streaming telemetry and eBPF. Suitable for ISPs, cloud operators, and large enterprises managing multi-cloud infrastructure.
Cons: Expensive and complex. Since it’s a SaaS platform, your flow data leaves your environment.
Protocol support: NetFlow, sFlow, IPFIX, SNMP, streaming telemetry, BGP, eBPF, and cloud flow logs
Pricing: Pricing starts at $2,000/month for the Pro edition, billed annually, with 50 users included, but there are other factors such as add-ons and usage limits that also affect total cost. A 30-day free trial is available.
6. Elastic Native NetFlow Integration
If you’re running the Elastic Stack and want to add flow visibility, Elastic’s native NetFlow integration is worth considering. It uses Elastic Agent as a flow collector, accepts exported packets via User Datagram Protocol (UDP), parses the records, manages templates for NetFlow v9 and IPFIX, and maps everything to the Elastic Common Schema (ECS). From there, you can build dashboards in Kibana or query the data directly in Elasticsearch.
Key features:
- Elastic Agent as a flow collector
- Template management for NetFlow v9 and IPFIX
- ECS field mapping for cross-platform correlation
- Kibana dashboards for visualization
Pros: If you’re already on Elastic, the native integration is a quick path to flow visibility.
Cons: The native Elastic integration requires Elastic Stack 8.14.0 or later.
Protocol support: NetFlow v1, v5, v6, v7, v8, v9, IPFIX.
Pricing: Elastic has a free tier; pricing depends on the deployment type (serverless, hosted, or self-managed).
You may also want to look into ElastiFlow if your primary goal is NetFlow analysis rather than general log and telemetry management. Originally an open-source project built on Logstash, ElastiFlow has since evolved into a commercial-focused network flow analytics platform. It supports NetFlow v5/v9, sFlow, and IPFIX, and integrates with Elasticsearch.
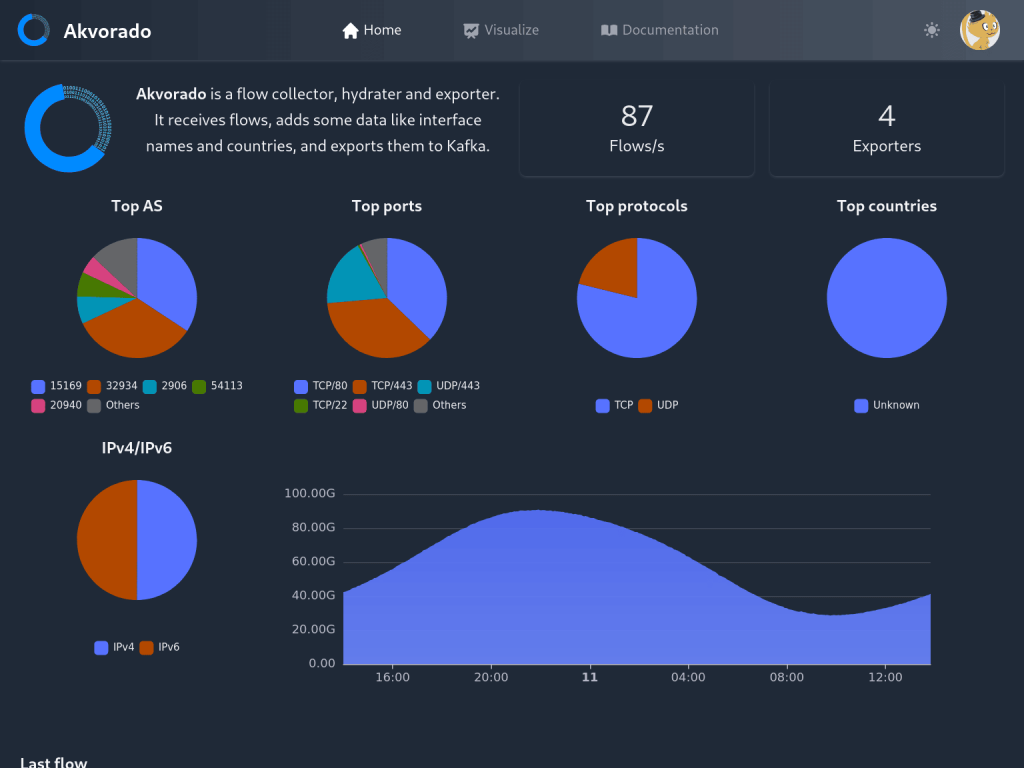
7. Akvorado
Akvorado is an open-source flow collector, enricher, and exporter. It receives flow data from routers, enriches it with geolocation and other data, and allows users to visualize it or export the enriched data to a ClickHouse database. Users can also analyze the data through a web UI.
Key features:
- ClickHouse-backed storage for fast queries over large datasets
- IPv6 support
- Kafka-based data pipeline between collection and storage
- Web UI with graphical, tabular, and map-based views
Pros: Free and open source. Strong query performance. Good for operators who want to self-host and have control over their data.
Cons: Requires self-hosting and familiarity with Linux and Docker to deploy and maintain. Some users reported difficulty setting it up.
Protocol support: NetFlow v9, IPFIX, sFlow
Pricing: Free and open source
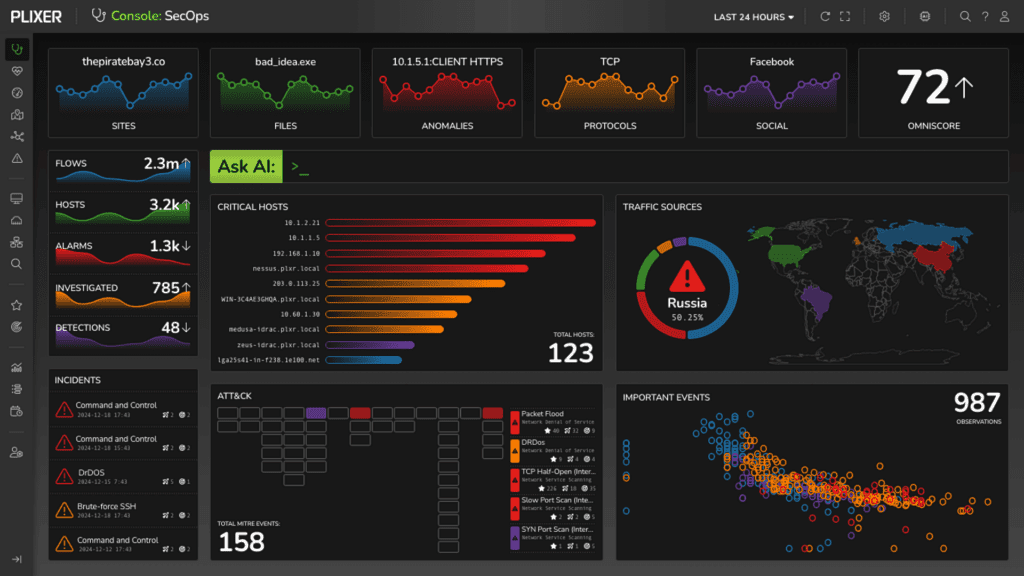
8. Plixer Scrutinizer
Plixer is a NetFlow traffic analysis platform aimed at enterprise network and security teams. It’s designed to handle high flow volumes without degradation, with buffering and stream processing built in to handle burst traffic conditions. The platform supports threshold-based alerting, report scheduling, and integration with other monitoring tools.
Key features:
- Real-time and historical data analysis
- Customizable dashboards and scheduled reports
- Alerting with device-level and interface-level granularity
- Integration with third-party monitoring platforms
Pros: Good fit for environments where NetOps and SecOps share responsibility. Positive user reviews around stability and support.
Cons: Some users say that you need to install a new server when updating the platform, which can lead to loss of data. Some advanced capabilities are add-ons rather than included in the base Scrutinizer package.
Protocol support: NetFlow, sFlow, IPFIX
Pricing: Plixer Scrutinizer starts at $850/month, billed annually, with public pricing tied to flow volume. Detailed package terms are disclosed through a custom proposal. A 30-day free trial is available.
9. nProbe
nProbe is a software-based NetFlow probe and collector from ntop. While ntop is an open-source network monitoring project, nProbe is a commercial product. It can collect flow data and act as a NetFlow exporter for flows generated by border gateways, switches, and routers, and it can serve as a drop-in replacement for embedded, low-speed NetFlow probes that may already be deployed.
Key features:
- Probe and collector modes in one tool
- Can integrate with ntopng for traffic visualization and analysis
- Cisco ASA and sFlow conversion to NetFlow v5/v9/IPFIX
- Available as software or on nBox hardware appliance
Pros: Strong open-source foundation — ntop has been around since 1998. Cross-platform.
Cons: Best results come from pairing with ntopng, which is a separate license.
Protocol support: NetFlow v5, NetFlow v9, IPFIX, sFlow
Pricing: nProbe Pro pricing starts at €99.95 for Raspberry Pi, while nProbe Pro for Linux/Win/FreeBSD costs €299.95.
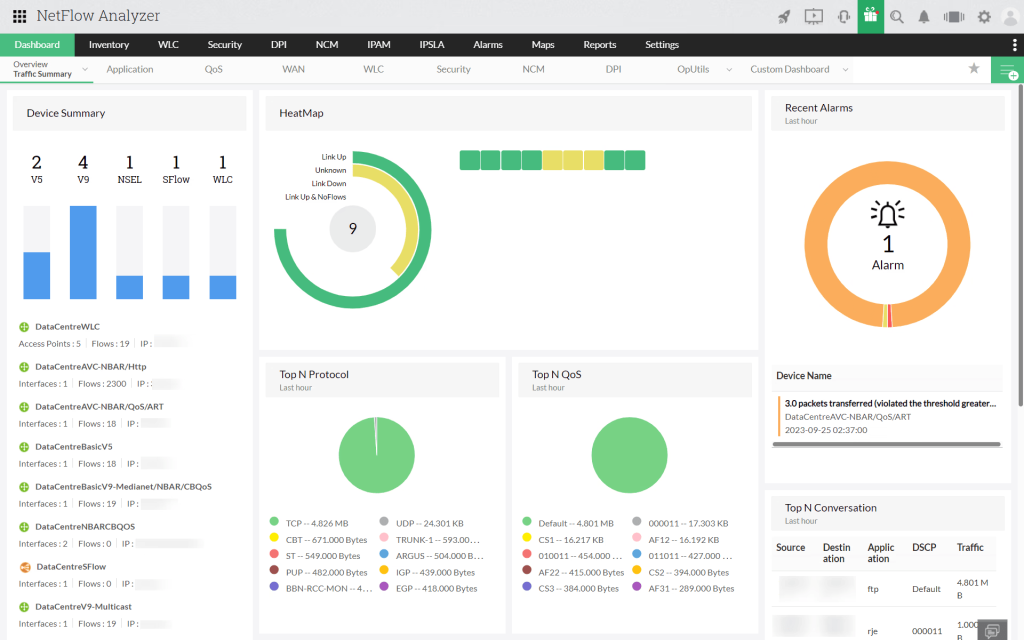
10. ManageEngine NetFlow Analyzer
ManageEngine NetFlow Analyzer is a bandwidth monitoring and traffic analysis tool that sits within the broader ManageEngine IT operations management suite. It’s compatible with both Windows and Linux.
The platform gives network administrators visibility into bandwidth utilization by interface, application, user, and conversation. It has an Advanced Security Analytics Module (ASAM) that uses continuous stream mining to detect anomalies and flag potential threats like DDoS patterns.
Key features:
- Real-time and historical traffic analysis
- Support for the widest range of flow protocols among tools in this list
- Bandwidth forecasting using machine learning
Pros: Runs on Windows and Linux. Broad protocol support.
Cons: Users report that filtering by application and port simultaneously can cause the software to lag, and the configuration interface isn’t very user-friendly.
Protocol support: NetFlow, sFlow, IPFIX, J-Flow, NetStream (Huawei), AppFlow (Citrix)
Pricing: A free edition is available for up to 2 interfaces. For monitoring 10 interfaces, the Standard Edition starts at $172, the Professional Edition starts at $595, and the Enterprise Edition starts at $1,045.
Other NetFlow Tools
The following categories are tools that don’t fit the aggregator and collector/analyzer molds but play a role in how NetFlow is generated, tested, or used.
Flow Generators
Flow generators create synthetic NetFlow records and send them to a collector without generating real network traffic. Their primary use case is helping network administrators test whether a NetFlow collector is running and configured correctly.
Example: nflow-generator lets you quickly verify that your collector is receiving data on the expected port.
Traffic Simulators
Traffic simulators are different from flow generators. Instead of generating fake flow records, they create actual packet traffic on the network, which causes real flow records to be exported by routers and switches. They’re used to test bandwidth capacity, stress network links, and validate that the full pipeline from router to collector to NetFlow analyzer is functioning correctly under load.
Example: Cisco TRex, an open-source stateful and stateless traffic generator.
Data Ingestion Platforms
Some platforms are built around broader data aggregation and analytics, and can ingest NetFlow as one data source among many. The catch is that you need a separate collector to get the flow data to them first.
Examples:
- Darktrace is a cybersecurity platform that uses machine learning to establish behavioral baselines for network entities. It can incorporate NetFlow data as part of that analysis.
- Splunk is a data analytics platform that can ingest and analyze NetFlow data through add-ons from Splunk itself (Splunk Stream) or other vendors on Splunkbase. It’s not a dedicated NetFlow tool, but if you’re already running Splunk for log management and security operations, adding flow data extends your visibility without introducing a new platform.
NetFlow Stream Processors
Stream processors sit between NetFlow collectors and analyzers. These tools are suitable when you’re dealing with very high flow volumes or when you need to send out flow data to multiple platforms with different format requirements.
They’re not analysis tools, but they perform important functions in high-scale environments:
- Data reduction: Sampling or filtering before storage
- Data enrichment: Adding Autonomous System Numbers (ASN) or geo data to raw records
- Format conversion: Translating between NetFlow versions or to IPFIX
- Routing: Sending flows to multiple downstream systems simultaneously
Examples: Apache Flink, Kafka Streams, Cribl
Conclusion
No single NetFlow tool can address every use case your organization may have. For most organizations, the most practical approach is to combine several tools: an internal flow analyzer to monitor network performance and detect unusual traffic patterns within the network, and an external intelligence layer that ties traffic to known threat infrastructure and covers external assets where installing and configuring flow collectors may be difficult.