


With recent regulatory changes pushing cybersecurity to the boardroom, effective attack surface monitoring and visualization techniques are more crucial than ever.
Security leaders need to measure and present important attack surface metrics to key stakeholders so they can understand what their organization is up against. In this post, we’ll tackle 10 critical metrics that can help make attack surface management and communication clearer.
Attack Surface Size
Here at Attaxion, we define an external attack surface as the sum of all Internet-facing assets and all the attack vectors associated with them. To measure it, one must determine the total number of external assets and their vulnerabilities.
These metrics provide a clear picture of an organization’s attack surface size, allowing security leaders to communicate security posture to all stakeholders and decision-makers, including nontechnical ones.
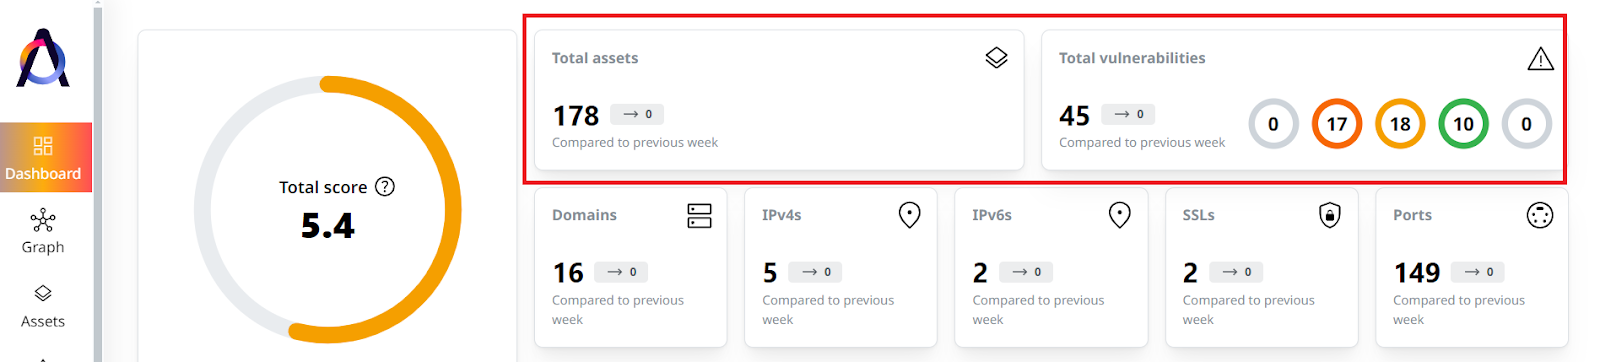
1. Total Number of Assets
Every asset an organization owns is a potential attack entry point. The more assets you have, the more complicated your infrastructure becomes, with several connections and interdependencies. Tracking the total number of assets enables security teams to immediately see the state of the organization’s digital footprint and threat exposure at a given time.
This metric also informs security teams if unnecessary or outdated assets need to be eliminated. For example, a surprisingly high number of assets may mean it’s time to examine the asset inventory more closely and remove unused or non-essential assets.
2. Total Number of Vulnerabilities
This metric tracks the overall number of vulnerabilities identified across the entire IT environment, regardless of whether they have been patched or not. Since each vulnerability is a possible doorway for attackers, the number of vulnerabilities and the total number of assets make up an organization’s attack surface.
Monitoring the total number of vulnerabilities helps security leaders make informed decisions. A persistently high number, for instance, may help justify additional resources for vulnerability and attack surface management.
Asset-Related Metrics
Measuring the external attack surface size is a good start, giving organizations an overview of their security posture. However, to really understand risks, asset-level metrics should be monitored. We’ll tackle them below.
3. Number of Root Assets
Organizations must ensure their external attack surface management (EASM) solutions track all the foundational assets critical to their operations. These may include domain names, IP addresses, Classless Inter-Domain Routing (CIDR), and cloud service accounts like those with Amazon Web Services (AWS), Microsoft Azure, Google Cloud Platform, and Digital Ocean.
These root assets are typically scanned to obtain their child assets. Since security teams have an initial idea how many root assets they have, they can compare this with the actual number of root assets detected by the platform to make sure everything is accounted for.
4. Number of Newly Discovered Assets
An organization’s security posture constantly changes as new assets get created and deployed, making an updated asset inventory necessary. However, aside from looking at each new asset, keeping track of their number within a specific time frame provides crucial insights. Knowing the number of assets added in a day or week may help narrow down the potential source of a recent security incident, allowing for faster containment and remediation.
This metric can also help organizations set thresholds for acceptable daily or weekly new asset additions. Anything beyond that can be flagged as an anomaly and trigger an investigation.
5. Number of Mapped Technologies
Aside from looking at asset-level numbers, monitoring an organization’s Internet-facing applications and technologies is also helpful, as these can introduce unique vulnerabilities and attack vectors.
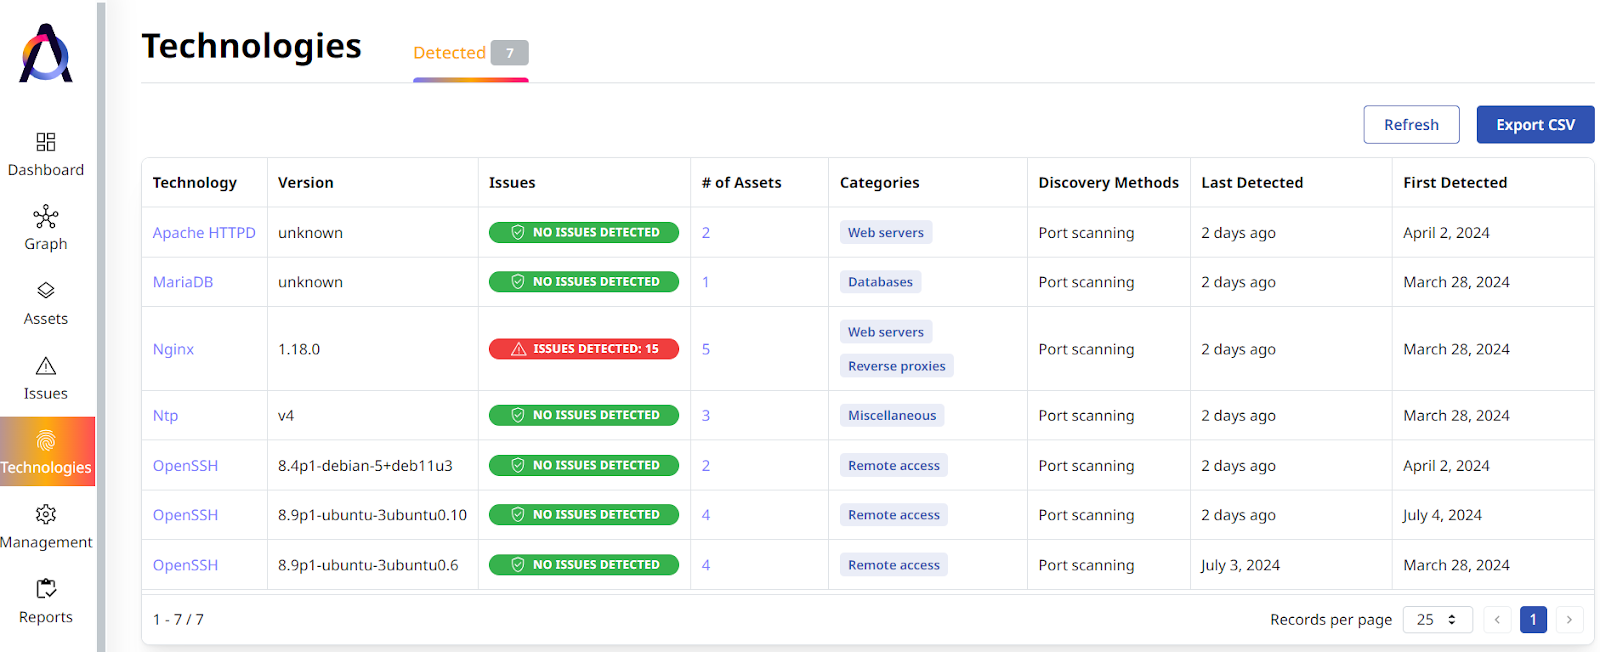
Tracking the number of mapped technologies helps identify potential security risks that may not have been considered before. For example, a surge in cloud-based technologies may necessitate reviewing your cloud security posture.
Moreover, the number of mapped technologies can inform vendor management strategies. This metric also allows security teams to categorize risks by technology type. You can prioritize security reviews for vendors whose technologies are widely used within your organization.
Vulnerability-Related Metrics
The sixth to tenth metrics focus on an organization’s vulnerabilities and are crucial for prioritizing remediation efforts, especially in light of Verizon’s 2024 Data Breach Investigations Report (DBIR) findings, which showed that vulnerability exploitation increased by 180%.
6. Average Vulnerability Scores
This metric is the average of all vulnerability scores, which usually involves those assigned using the Common Vulnerability Scoring System (CVSS), the Exploit Prediction Scoring System (EPSS), or a combination of these and other scoring mechanisms.
The average vulnerability score serves as a quick indicator of the overall seriousness of a vulnerability. The higher the score, the more vulnerable an organization is. The score is a clear and concise metric that helps leaders and the board of directors easily understand the potential impact of vulnerabilities on their organization.
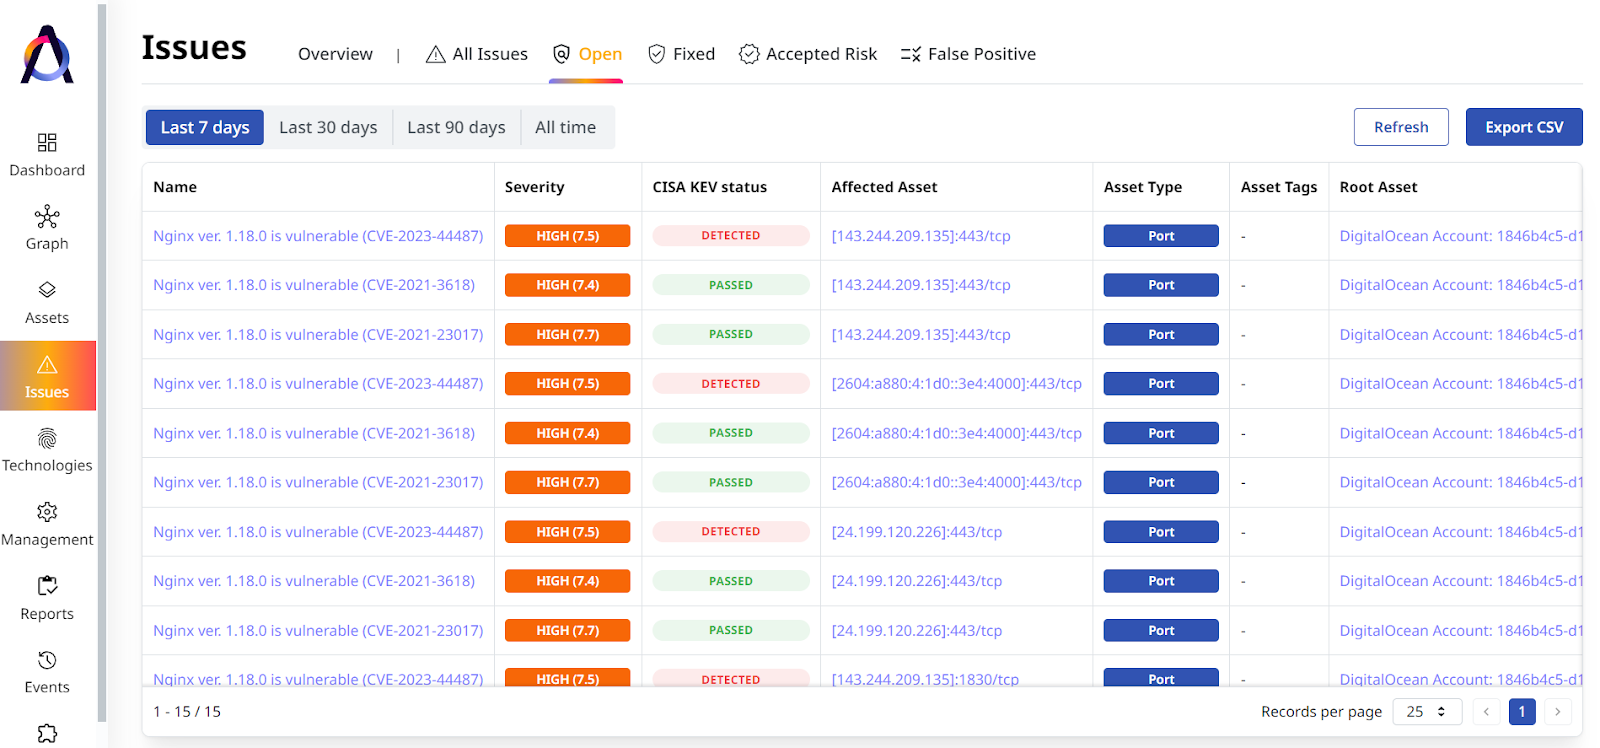
7. Number of Open Security Issues
Security teams must know how many vulnerabilities they are actively dealing with to get a high-level view of their organization’s security risks. Monitoring the trend for the number of open issues over time also allows security leaders to assess the effectiveness of their security efforts. Are you proactively identifying and fixing issues, or is your backlog growing?
Being able to measure this number allows organizations to compare their performance against industry benchmarks. For instance, the Cybersecurity and Infrastructure Security Agency (CISA) recommends a remediation timeline of 15 calendar days for critical vulnerabilities and 30 days for those with high scores.
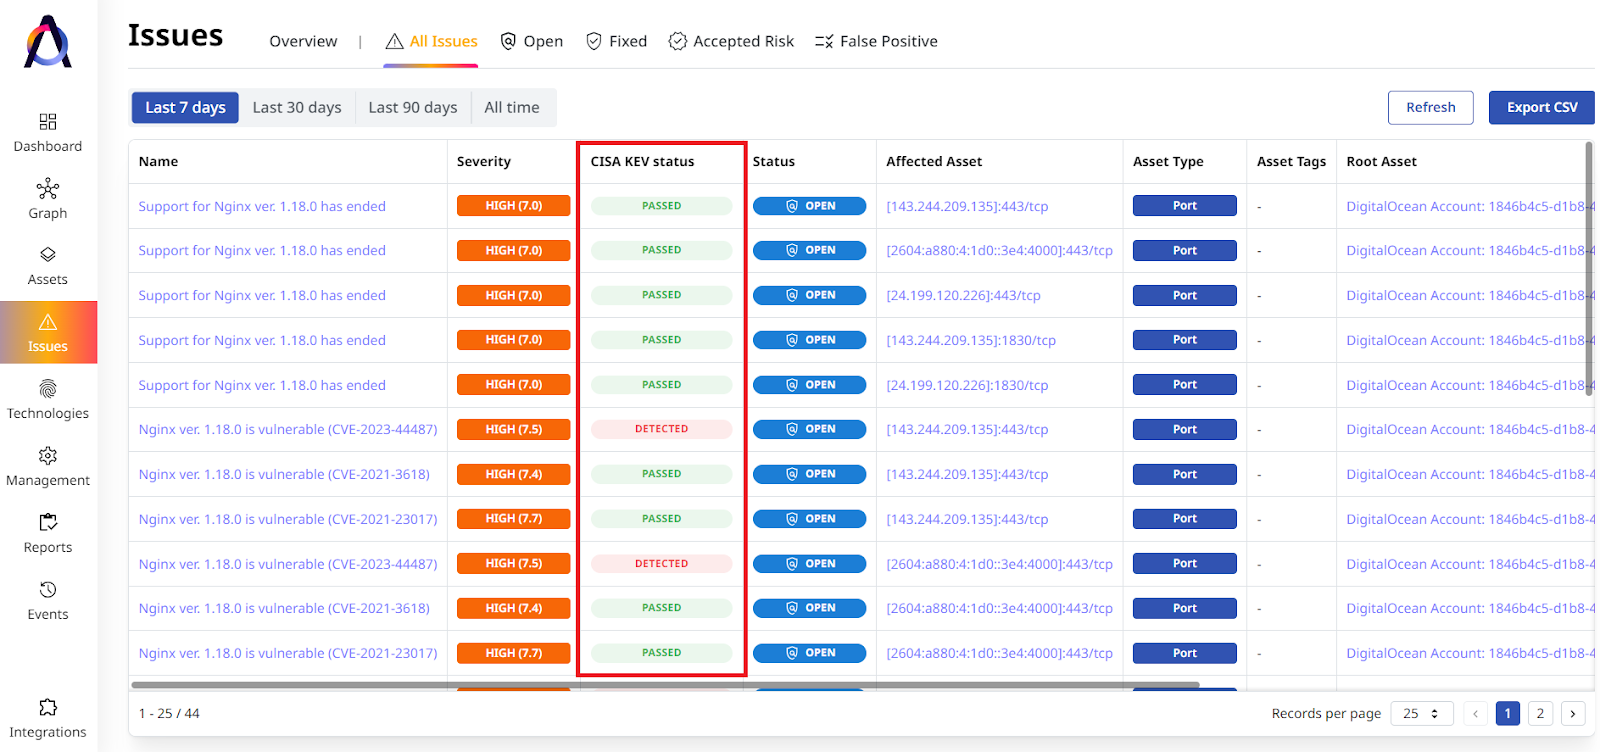
8. Number of Exploitable Security Issues
CISA maintains a Known Exploited Vulnerabilities (KEV) catalog that keeps track of vulnerabilities that are actively exploited in the wild. Tracking the number of vulnerabilities that are found on the CISA KEV Catalog helps organizations effectively prioritize vulnerability remediation efforts by highlighting the most exploitable issues.
9. Number of Affected Assets
Looking at the number of assets affected by each vulnerability can help security teams understand its potential reach and impact. This information can be used for remediation prioritization, especially if a critical vulnerability affects many assets.
In addition, the number of affected assets gives nontechnical stakeholders a glimpse of the potential consequences of unaddressed vulnerabilities, helping security teams communicate risks and the need for proposed security investments and initiatives.
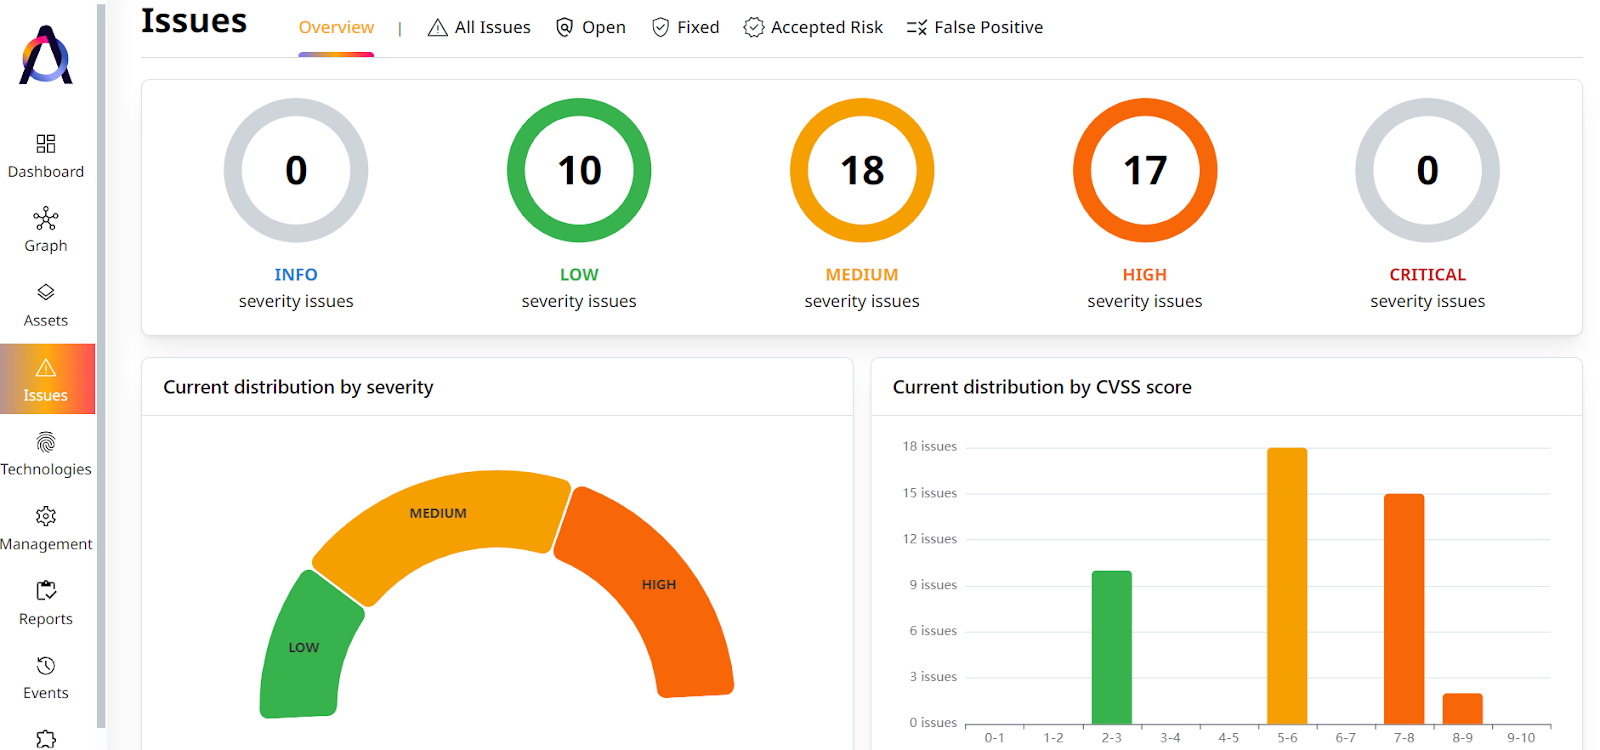
10. Distribution of Vulnerabilities by Severity
This metric enables security teams to see the number of vulnerabilities according to severity (low, medium, high, and critical). It helps them understand the breakdown of vulnerabilities to prioritize remediation efforts and allocate resources efficiently.
Tracking the distribution of vulnerabilities by severity also shows how security measures are performing. For example, a decrease in the percentage of critical and high vulnerabilities indicates progress in patching and overall security improvement.
This metric also helps communicate the relative risk levels associated with vulnerabilities to nontechnical stakeholders. For instance, a lower percentage of critical vulnerabilities can reassure them about their security posture. In contrast, a high number of critical vulnerabilities will help decision-makers understand the need for additional resources or security investments.
Conclusion
While developing and implementing security strategies and mitigating risks is the top priority of chief information security officers (CISOs) and other cybersecurity leaders, they also need to clearly communicate cyber risks to the board. These metrics can help them do just that.
Start tracking your organization’s critical attack surface metrics. Kick off your 30-day free trial with Attaxion today.