


You looked at the results from your most recent vulnerability scan, and there’s… a lot to take in.
How do you translate all that technical data into something that is actionable for your team and understandable to leadership? Some quantification could probably help. In this post, we tried to gather everything that is quantifiable about vulnerability management. Check out this list of 19 vulnerability management metrics that you can use for prioritization, reporting, and more.
Why Should You Track Vulnerability Management Metrics?
Sometimes, practitioners think of tracking metrics as a burden. Between managing different tools, running vulnerability assessments, and explaining obvious things to other teams for a millionth time, your workload is already very heavy. Wouldn’t all this tracking make it even harder?
The answer is more “no” than “yes”, because, while tracking vulnerability metrics does take time, having them at hand helps with a variety of different tasks, including getting your ideas across to both admins and the management board.
Here are some specific reasons why tracking vulnerability metrics is important:
- Metrics help you justify your budget and choice of tools: Security tools and staff are major investments that are often under scrutiny and tend to get cut — a recent survey shows that around 12% of North American and 13% of Latin American and Caribbean organizations have reduced their cybersecurity budgets in response to geopolitical volatility. Vulnerability management metrics provide data-driven evidence that your scanning tools and automation platforms are actually effective and help the organization stay secure and compliant. Also, showing a measurable drop in critical vulnerabilities or a shorter remediation window helps you build a much stronger case for a promotion.
- Vulnerability management metrics help get different teams on the same page: Security, DevOps, and IT teams may sometimes have conflicting priorities, but shared SLAs — such as a target to fix critical vulnerabilities within ten days instead of thirty — provide a common goal. This alignment reduces friction during patch rollouts and ensures that every group understands how their work affects the company’s security posture. And those SLAs require metrics, otherwise they don’t work.
- Metrics reveal trends and patterns: Tracking data over several months helps you detect recurring patterns, such as repeating misconfigurations or specific departments that consistently miss patching deadlines. That is leverage you can use while talking to management. Also, forewarned is forearmed — if you know where to expect problems, you can prepare to address them.
- Metrics enable you to optimize resources and workflows: Metrics help you find bottlenecks where patches get delayed or where scans fail. Monitoring these data points can ensure your team uses its time economically and focuses on the vulnerabilities that actually matter to the organization.
- Vulnerability management metrics help simplify audits and regulatory compliance: Many frameworks require proof that you remediate vulnerabilities within a specific timeframe. Therefore, maintaining a log of your patching activities and response times means you’re always ready for a surprise audit. Consistent documentation builds trust with regulators and prevents the stress of a last-minute scramble for data.
Operational Metrics vs. Business Outcomes
There is a gap in priorities between security teams and the board, which is clearly shown in the Splunk CISO Report 2025.
Boards of directors typically care about compliance, ROI, and the financial impact of an incident. They want to know if the business is resilient and if security spending is effective.
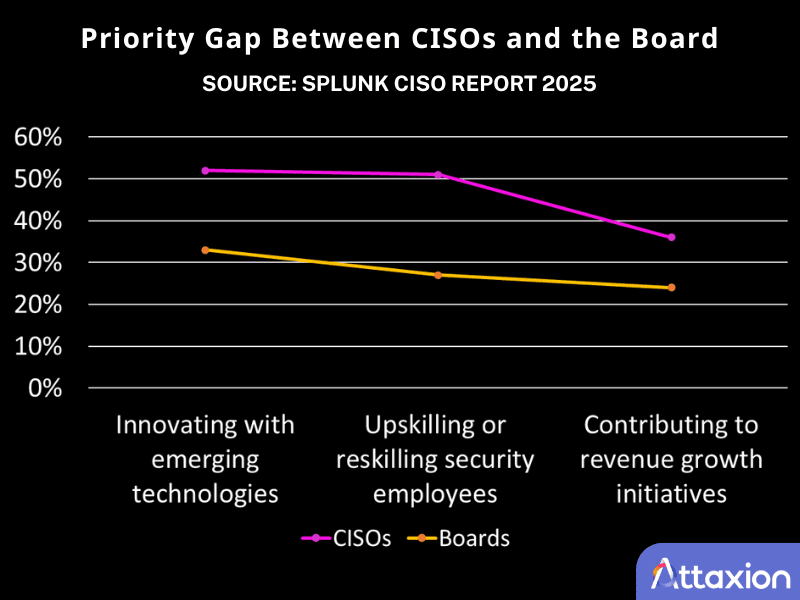
Security leaders and team members care more about upskilling the team and avoiding incidents. Their idea of metrics looks like Mean Time to Detect (MTTD) or Mean Time to Respond (MTTR) — if you’re unfamiliar with them, we’ll explain both of these later in the article. However, while these details keep security operations going, they rarely satisfy a board looking for business outcomes. You need different sets of data to keep everyone happy.
With all that said, it’s tempting to track every data point just to cover all bases. But more data doesn’t always lead to better security. If you try to monitor dozens of KPIs at once, you will likely end up with noise instead of insights.
Below, we list 19 different vulnerability management metrics you can track. You absolutely shouldn’t even try to track them all. Yet, you absolutely should track at least some, so that you can prioritize, assess your own efforts, and report to the board the way that satisfies them and helps justify your cybersecurity budget for the next year.
19 Vulnerability Management Metrics
Visibility and Detection KPIs
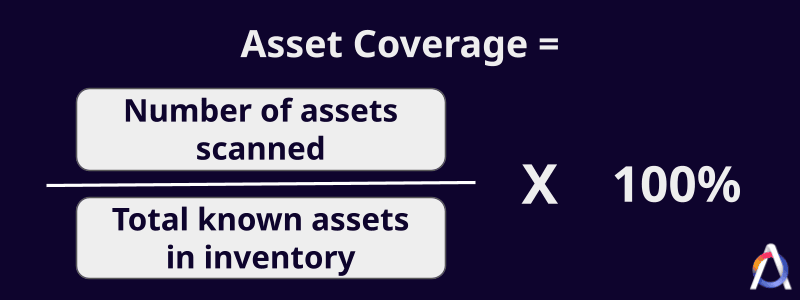
1. Asset Coverage
Even if you know all your assets, you don’t get to see what’s going on with them if your security tools don’t have decent asset coverage. To get an idea about what is under control vs. what isn’t, you can track asset inventory coverage, the percentage of your total environment that your vulnerability scanners actually see.
Why it’s relevant: Asset coverage alerts you to any blind spots. If your inventory shows 1,000 assets but your scanner only reaches 800, you have a 20% blind spot where vulnerabilities can sit undetected.
Drawback: The effectiveness of this metric depends on the accuracy of your asset inventory. If your inventory is out of date and there are unknown assets, a high coverage score can give you a false sense of security. To compensate for this, you can use security tools with automated asset discovery. They often reveal assets that you didn’t even know existed — and probably are vulnerable.
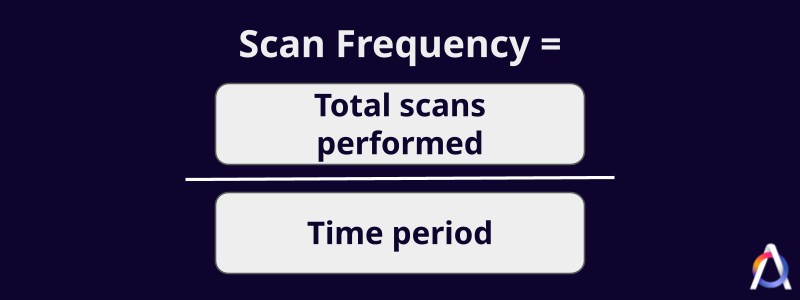
2. Scan Frequency
This metric indicates how often you run security assessments for a specific group of assets. You may want to compute this for different assets, since high-risk assets (e.g., public-facing systems) probably require more frequent scans than other, less exposed assets.
Why it’s relevant: This metric helps you gauge whether your documented security posture (what you see in the dashboards) is up to date or not.
Drawback: It’s worth noting that frequency doesn’t equal quality or wide scan coverage. Scanning daily with a misconfigured tool won’t yield better results than scanning monthly with a well-configured scanner.
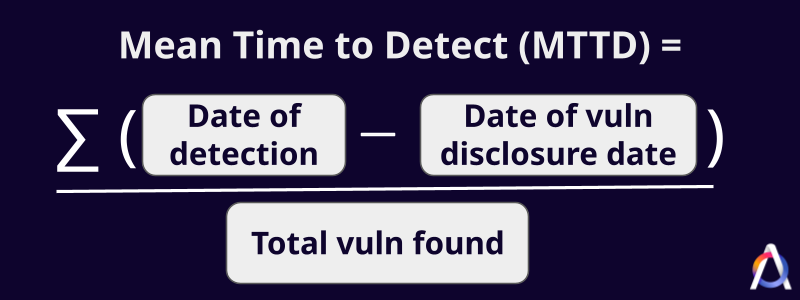
3. Mean Time to Detect (MTTD)
MTTD is the average time it takes for your team to find a security vulnerability after it becomes public or enters your environment. To track it, for example, you can use the Attaxion API to compare the first_seen timestamp against the CVE record publication date or the addition date of the asset (if it was added later than the CVE was published). It may be worth tracking MTTD separately for issues of different severity.
A low MTTD means you find vulnerabilities earlier rather than later, while a high number could mean that your scan frequency is too low or maybe your scanner is slow to add detection rules for new vulnerabilities, giving threat actors a larger window of opportunity to exploit them.
Why it’s relevant: Threat actors develop exploits within an average of 44 days of vulnerability disclosure — as early as one day for one-third of exploited vulnerabilities on the Known Exploited Vulnerabilities (KEV) catalog and even before disclosure, for zero-day vulnerabilities. Therefore, tracking MTTD and keeping it low is very important.
Drawback: MTTD can be skewed by legacy vulnerabilities that were present long before you started using your current scanning tools. If a tool doesn’t allow users to mark issues as “accepted risk,” those vulnerabilities that are consciously left untreated also tend to inflate MTTD.
4. Vulnerability False Positive Rate
This is the frequency of noise or inaccurate alerts in your reports. A high rate can stem from automated scanners misidentifying software versions or failing to account for existing security controls.
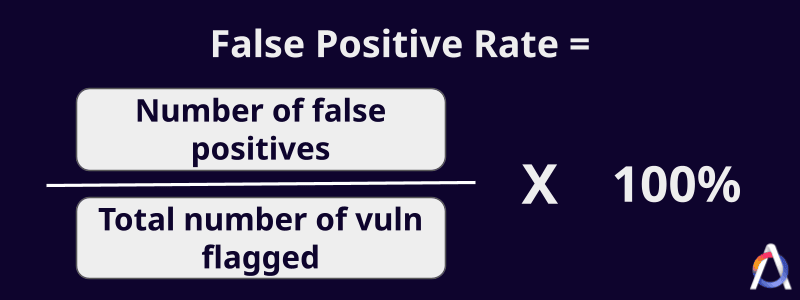
Why it’s relevant: High false positive detection rates lead to alert fatigue and burnout, where security teams begin to ignore all alerts, no matter whether they are valid or not.
Drawback: Lowering the false positive rate too aggressively can lead to false negatives, where the tool misses real threats just to keep the report clean.
Risk and Prioritization KPIs
5. Severity Score
A severity score quantifies how much damage a successful vulnerability exploitation can cause. It is typically measured using the Common Vulnerability Scoring System (CVSS) on a scale from 0 to 10 and is computed based on different aspects.
Why it’s relevant: With nearly 50,000 new Common Vulnerabilities and Exposures (CVEs) published in 2025 alone, security teams need CVSS as a standardized way to measure which vulnerabilities deserve their attention the most. If an issue is not in the CVE catalog, there’s still a way to calculate its severity using a special severity calculator.
Drawback: CVSS only measures severity, not risk. It doesn’t take into account the specific environment affected by the vulnerability, so a high severity score may not necessarily mean your organization is at risk.
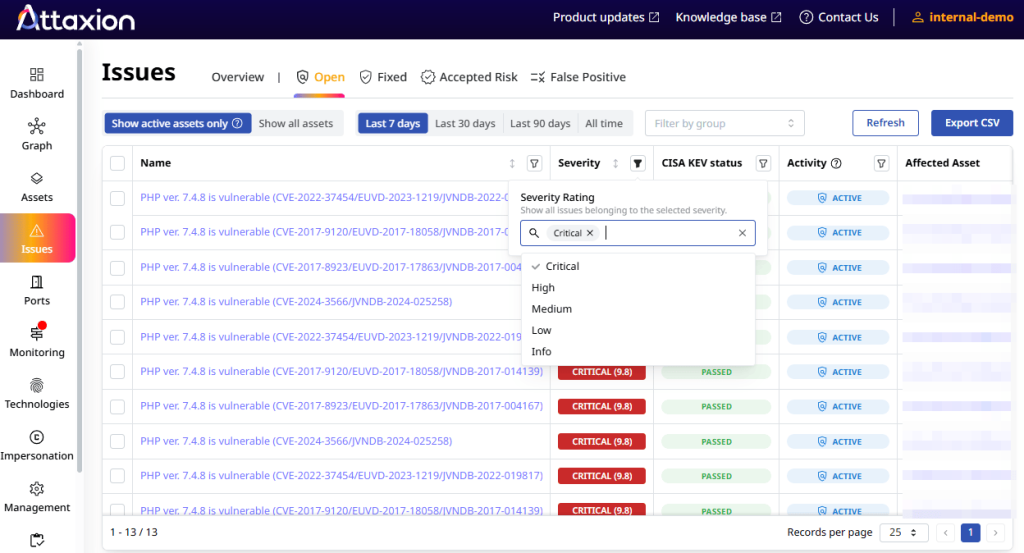
6. Qualitative Severity Ratings
Categorizations like Low, Medium, High, or Critical simplify the CVSS number into actionable tiers. The National Vulnerability Database (NVD) has published these qualitative severity ratings.
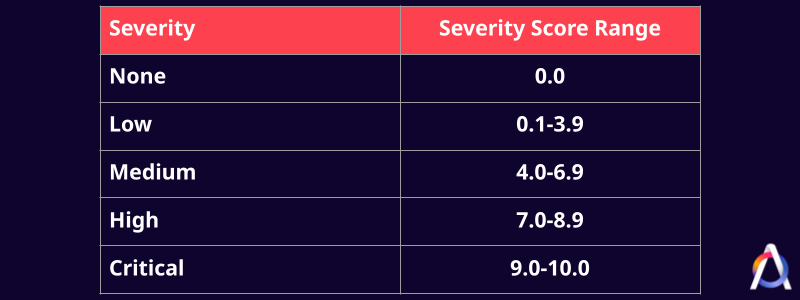
Why it’s relevant: Qualitative rating makes complex technical data more relatable for leadership and stakeholders. “Medium severity” and “High severity” sound much more understandable than a 6.8 and a 7.1 CVSS score. Saying “we’ve fixed all critical vulnerabilities” sounds like a statement, while “we’ve fixed all vulnerabilities with CVSS 9.0 or more” may raise more questions.
Drawback: Approximately 39% of the new vulnerabilities disclosed in 2025 were rated high or critical. Using qualitative ratings without the actual scores can group a huge number of vulnerabilities into one pile, leaving security teams struggling to prioritize within that pile.
7. Exploitability Data
These metrics show if a vulnerability is known to be actively exploited by attackers or is likely to be exploited soon. There are two intelligence sources commonly used for this:
- Known Exploited Vulnerabilities (KEV) catalog: Managed by the Cybersecurity and Infrastructure Security Agency (CISA), the KEV catalog is a curated list of vulnerabilities that have reliable evidence of active exploitation in the wild. The metric here is merely the presence of an issue in the KEV Catalog: yes or no.
- The Exploit Prediction Scoring System (EPSS): EPSS uses machine learning to predict what will happen. It estimates the probability that a vulnerability will be exploited within the next 30 days, using a potential exploitability score of 0 to 1.
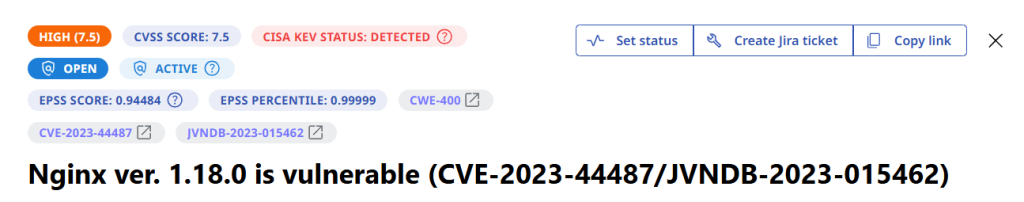
Why it’s relevant: Including exploitability data makes vulnerability prioritization much more accurate. After all, fixing a medium-severity issue that is known to be exploited in the wild is more urgent than a high severity one that has no known way of exploitation.
Drawback: Note that EPSS is a probability score, not a certainty. A vulnerability with low exploitation probability can still be weaponized by a determined attacker.
8. Risk Score
This score combines vulnerability severity and exploitability with the business importance of the affected asset. It adds organizational context to technical data, making it one of the most important metrics to track.
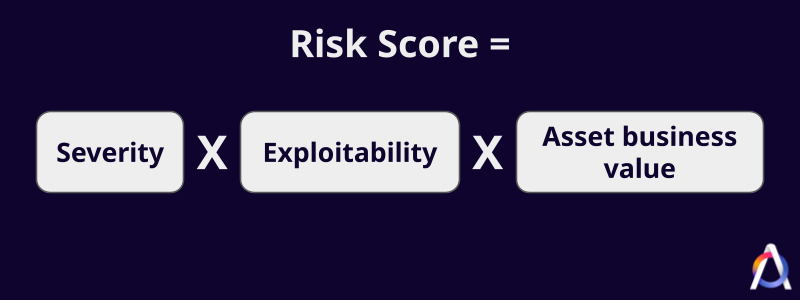
To get your organization’s aggregate risk score, you simply add each vulnerability’s risk score and then divide it by the number of vulnerabilities.
Why it’s relevant: It ensures you fix the things that actually matter to the business first (e.g., customer databases over internal wikis), effectively aligning security with business goals. The dynamic of the overall risk score is also a great number to show to the board.
Drawback: Assigning business importance to thousands of assets can be subjective and requires constant manual updates.
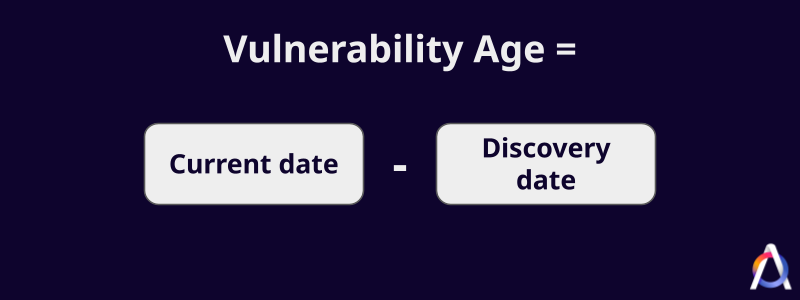
9. Vulnerability Age
This metric measures the time between the vulnerability’s discovery date and the current date, which helps security teams adhere to remediation deadlines or SLAs that security frameworks and internal policies set. Additionally, the older the vulnerability, the more likely a threat actor is to exploit it.
Why it’s relevant: Aside from helping ensure SLA compliance, vulnerability age can be used as an indicator that shows whether, in certain areas, your vulnerability remediation process has stopped working as intended.
Drawback: This doesn’t account for vulnerabilities that are accepted risks or have compensating controls.
Remediation Efficiency KPIs
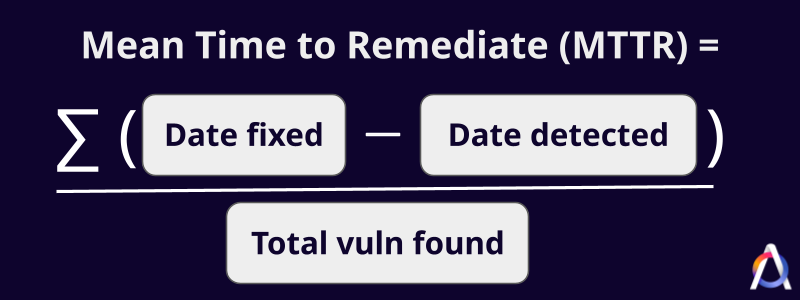
10. Mean Time to Remediate (MTTR)
MTTR is the average time it takes to patch or close a vulnerability after detection. The figures vary per industry. Based on a 2025 report, software companies have the fastest MTTR at 63 days.
Why it’s relevant: MTTR is the primary indicator of how agile and effective your security response is.
Drawback: A few very difficult vulnerabilities can drag up the average, making the team look slower than they actually are.
11. Remediation Rate
While MTTR is measured in days, the remediation rate is the percentage of vulnerabilities that are successfully closed within a specific period. This metric helps you see if your team is effectively clearing your backlog or if it’s growing out of control.
Typically, the remediation rate is computed for each severity level, so that you know the remediation rate specifically for critical and high-severity vulnerabilities.

Why it’s relevant: It helps you see if your remediation program aligns with SLAs and overall security goals, and if it doesn’t, you can analyze and try to address it. If the rate is consistently low, your team could be understaffed for the volume of issues being found.
Drawback: Closing tickets related to false positives might make the remediation rate look better than it really is.
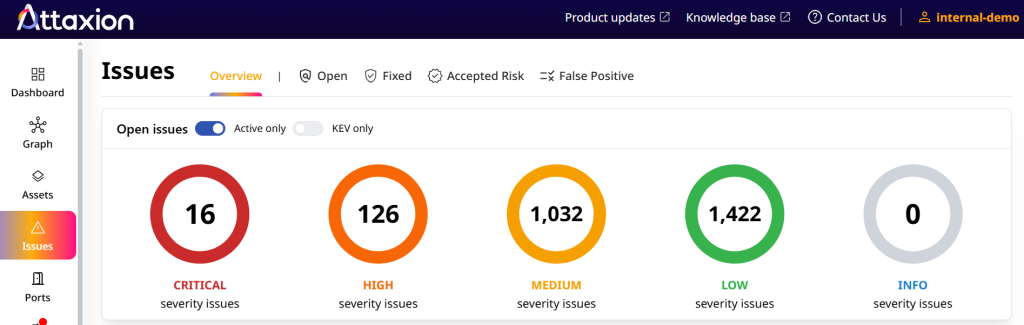
12. Total Number of Open Vulnerabilities
This metric shows the current size of your backlog of unfixed vulnerabilities. With approximately 170 new CVE records appearing daily in 2026 (15,781 total CVEs published in 2026, as of April 3, 2026), this number can be overwhelming, which is why prioritization is very important.
Why it’s relevant: The total number of open vulnerabilities helps you track the growth or reduction of your organization’s attack surface over time.
Drawback: Without context, this number is scary but meaningless. A large organization will likely have thousands of open low-level security vulnerabilities at any moment in time.
13. Total Number of Critical Vulnerabilities
This is the focused count of the most dangerous open issues, the metric that both security teams and the board want to see go down.
Why it’s relevant: It filters out the noise and focuses purely on the vulnerabilities most likely to lead to a data breach.
Drawback: Focusing only on critical vulnerabilities might lead teams to ignore high or even medium security issues that can be chained together for an attack.
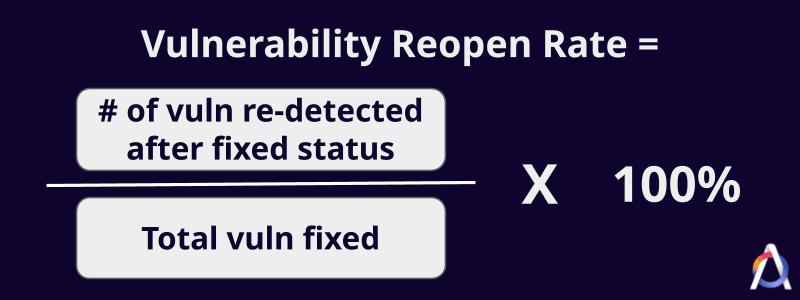
14. Vulnerability Reopen Rate
This metric shows how often vulnerabilities that were supposedly “fixed” return to your environment after an unsuccessful remediation. A high rate suggests issues with the efficiency of your remediation program because, ideally, when a remediation ticket is marked resolved, the same vulnerability on the same asset should not be detected again.
Why it’s relevant: If a vulnerability keeps coming back, your team is likely treating the symptom, not the root cause.
Drawback: Sometimes, regression is caused by scanner inconsistencies or changes in network visibility rather than a failed patch.
15. Patch Reversal and Success Rate
Patch reversal rate refers to the percentage of patches that are rolled back due to system instability or errors in relation to the total number of patches applied.
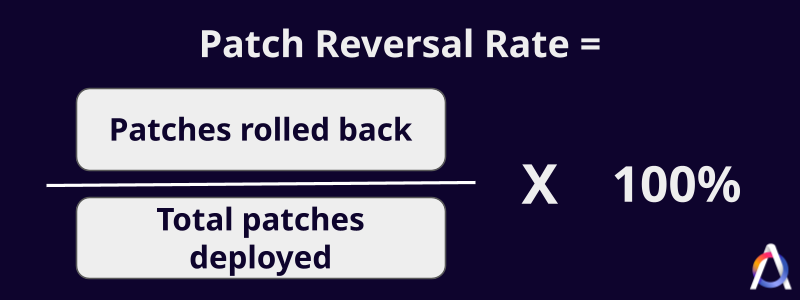
The patch success rate is the opposite of that — the percentage of updates deployed without any issue.
Why it’s relevant: High reversal rates suggest your patch management team needs better testing environments before deploying to production.
Drawback: High patch success rates are good, but if you only patch easy things to keep the rate high, you aren’t actually making things more secure.
Governance and Compliance KPIs
16. Service Level Agreement (SLA) Compliance Rate
SLAs define the maximum allowable time for security teams to remediate security vulnerabilities, and the SLA compliance rate tracks the percentage of vulnerabilities fixed within that deadline. For example, company policy might mandate fixing critical vulnerabilities within 48 hours.

Why it’s relevant: Tracking SLA compliance rates ensures accountability to internal policies and regulatory requirements.
Drawback: Aiming to keep this metric high could lead to teams focusing on easy-to-fix security vulnerabilities before the deadline while overlooking difficult but more dangerous ones.
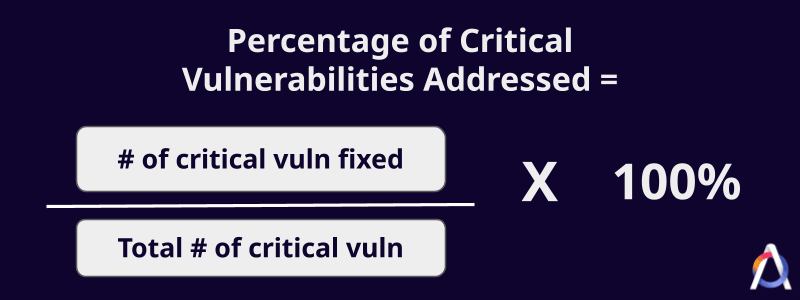
17. Percentage of Critical Vulnerabilities Addressed
This metric measures how effectively the team is neutralizing the highest-priority threats and, therefore, reducing high-level risks. It differs from the general remediation rate by focusing strictly on the most urgent items.
Why it’s relevant: This directly correlates to risk reduction and gives leadership a clear sense of how well-protected the environment is. If your general remediation rate is low but this specific metric is high, it shows you are successfully prioritizing the most dangerous security risks.
Drawback: The metric doesn’t show the effort required: some criticals require simple updates delivered in a few commands, while others take hours of work to remediate. Also, it doesn’t take exploitability into account.
Business Impact KPIs
18. Risk Score Reduction Over Time
This metric shows the trend of how security efforts are lowering the organization’s total attack surface. It’s a very effective way to measure the ROI of your vulnerability management program.
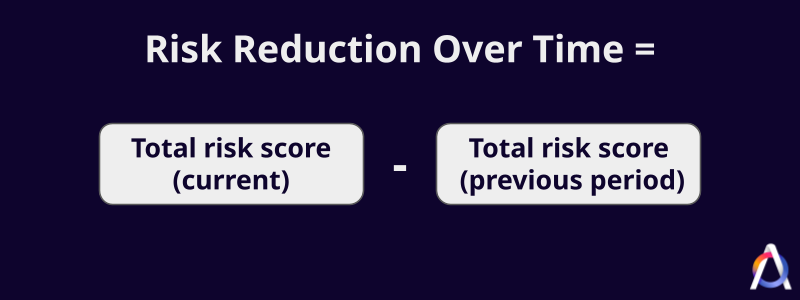
Why it’s relevant: It proves that your program is actually making the company safer, rather than just treading water as new vulnerabilities appear.
If you’re using Attaxion for vulnerability management, you can rely on the Attaxion API to export risk scores regularly and build a graph to visualize this trend.
Drawback: If your asset inventory grows significantly (e.g., during a merger and acquisition deal), your total risk score might go up even if your security team is doing an excellent job.
19. Total Vulnerability Remediation or Patching Cost
This figure is the total financial and human resource investment required to manage security vulnerabilities, and this varies between organizations.
According to IBM, the global average cost of a data breach was $4.4 million in 2025, making remediation costs seem small by comparison.
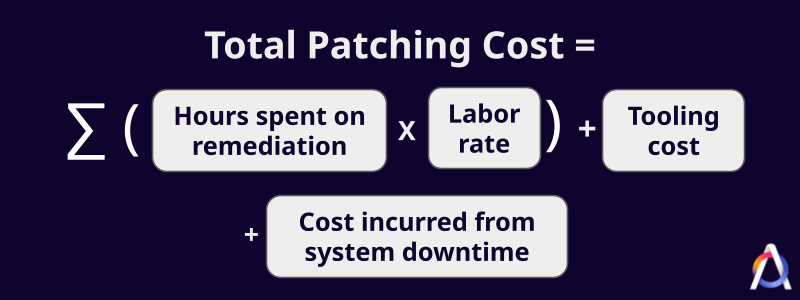
Why it’s relevant: This metric helps business leaders understand the cost of doing business in a digital world and can be used to justify the shift toward automation tools like Attaxion, which reduce the manual hours required for discovery and prioritization.
Drawback: It’s quite difficult to calculate accurately, as it involves tracking actual labor rates, the cost of tools (OK, it’s zero if you’re using open-source vulnerability management tools), and potential downtime. Some may even include the indirect cost of pulling developers away from revenue-generating features to fix vulnerabilities.
Which Metrics Do Compliance Standards Require?
Different security regulations require different proof that you’re complying with them. Here’s what they may look like:
- The General Data Protection Regulation (GDPR): Article 32 requires “a process for regularly testing, assessing and evaluating the effectiveness of technical and organisational measures for ensuring the security of the processing.” Tracking scan frequency and MTTR can help here. In addition, Article 33 requires organizations to notify authorities within 72 hours of a personal data breach occurring, but this relates more to incident response metrics rather than to vulnerability management.
- Payment Card Industry Data Security Standard (PCI DSS): Requirement 11.2 of PCI-DSS requires quarterly external and internal scans. These scans “must not contain high-level vulnerabilities in any component in the cardholder data environment.” To pass, you must make sure that scan frequency is at least quarterly, your scan coverage includes all assets participating in the cardholder data environment (whatever it means in your specific case), and your remediation rate for medium, high, and critical vulnerabilities must be 100% for those assets.
- The Health Insurance Portability and Accountability Act of 1996 (HIPAA): The regulation’s Security Rule requires regulated organizations “to perform an accurate and thorough assessment of the potential risks and vulnerabilities to ePHI, and it must manage risks by implementing security measures that reduce risks and vulnerabilities to a reasonable and appropriate level.” Metrics like risk scores, MTTR, risk reduction over time, and SLA compliance rate can help align organizations with HIPAA rules.
- The California Consumer Privacy Act (CCPA): Organizations under CCPA are required to “implement reasonable security procedures and practices appropriate to the nature of the personal information” they collect. While this is somewhat broad, this still means that it’s important to measure asset coverage to ensure all systems containing California residents’ data are identified. You also need a high remediation rate for any vulnerability that could lead to unauthorized access, as “reasonable security” is often measured against industry standards like the CIS Critical Security Controls or NIST Cybersecurity Framework.
Conclusion
Aiming to track all 19 vulnerability metrics we talked about in this post would be unrealistic, but you should definitely track something.
Start with a few high-impact KPIs that align with your current goals (and make sure that management can understand and is interested in at least some of those). Once those processes are stable and the data is reliable, you can gradually add more complex reporting to your program if you feel the need for it.
Notice how those vulnerability management KPIs actually overlap with attack surface management (ASM) metrics. Asset coverage, vulnerability severity scores, number of open vulnerabilities, and exploitability data, for example, can also be tracked using ASM platforms. In addition to these, ASM platforms can also track other important metrics such as attack surface size, SSL certificate health, number of mapped technologies, port exposure rate, and DNS integrity.
Try out Attaxion and get your vulnerability management program to the next level.